
Latest Prototypes
Interactive Charts
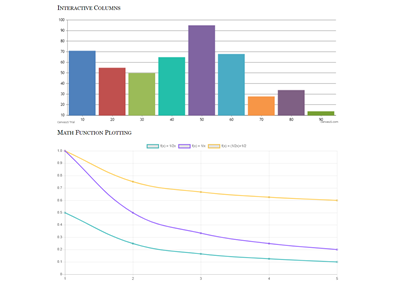
Using js libraries to manipulate data on charts.
Benford's Law
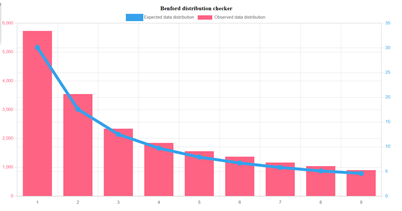
This is a Python based web application (Flask) that ingests data, generates its number distribution and helps spot any anomalous number(s) in a real-life set.
Harshad City Temperatures
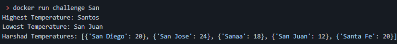
This lightweight Python application uses a couple of APIs to quickly fetch, parse and expose data.
Tech job market fluctuation by programming language
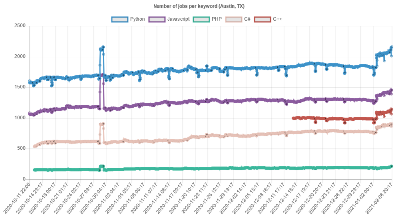
A 5-month experiment that involved data scraping to monitor job fluctuation on an employment search engine.
Mineralogical and Fluid Composition Palette
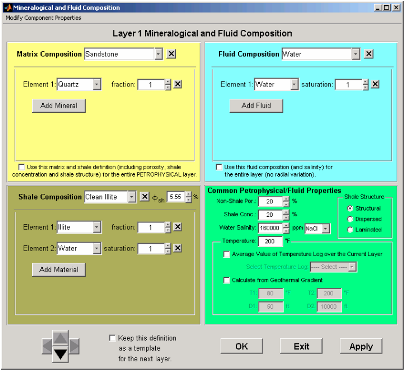
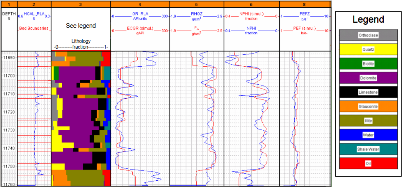
Taken from pages 9 and 31 of Master's thesis, this is an example of an interactive UI solution, prototyped and adapted to Fomation Evaluation consortium affiliates.
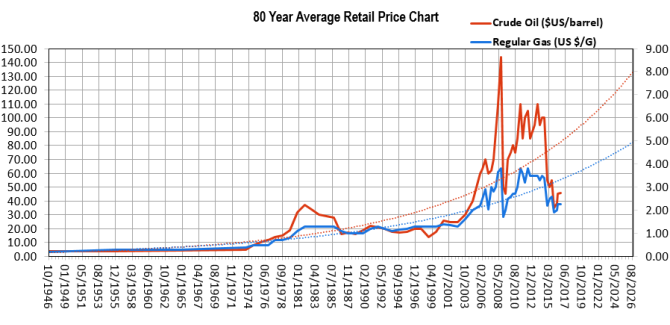
Historical Gas Price Chart
Bjarne Stroustrup
Crude Oil Price
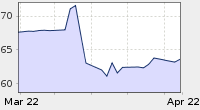
WTI Crude Oil over the last month.